
Polymerization Batch Process
Detecting Abnormal Styrene–Butyl Acrylate Polymerization Batches
Case StudyPolymerization Batch Process09 min readOctober 10, 2026
Detecting a Bad Batch Before Final Quality Testing
Detecting Abnormal Batches Early in Styrene–Butyl Acrylate Emulsion Polymerization with Online Batch Classification
A styrene–butyl acrylate emulsion polymerization unit operates as a semi-batch process in which product quality depends on the combined trajectory of monomer and initiator feeds, reactor temperature, cooling duty, agitation, and reaction progress. Final quality measurements are available only after the batch is complete. By using Multiway Principal Component Analysis (MPCA) to classify each live batch against a historical normal operating region, the plant can identify abnormal behavior earlier, isolate the variables driving the deviation, and create a foundation for quality prediction and batch optimization.
The Challenge: Detecting a Bad Batch Before Final Quality Testing
The polymerization is sensitive to recipe execution and heat-management conditions throughout the run. Traditional one-variable-at-a-time control charts may show every individual tag within its limit even when the overall multivariate batch trajectory has shifted away from normal operation.
The Blind Spot: Operators have limited visibility into whether the combined process trajectory is still consistent with historically successful batches.
The Alignment Problem: Batch duration and sampling frequency vary from run to run, making direct clock-time comparison unreliable.
The Quality Risk: A developing process deviation may not be recognized until final viscosity, conversion, or residual-monomer testing is available, leaving little opportunity to investigate or correct the batch.
The Solution: Online Multivariate Batch Classification
The process data are organized as a three-way array - batches × process variables × normalized reaction progress - and compressed into a low-dimensional latent operating space using MPCA.
Golden-Batch Modeling: A historical set of successful production batches is used to define the normal operating region and multivariate confidence limits.
Batch Synchronization: Each run is mapped to normalized reaction progress so equivalent stages of different-length batches can be compared.
Online Classification: As a new batch progresses, its partial trajectory is projected into the MPCA model. Score and prediction-error statistics indicate whether the batch remains consistent with the golden batch.
Fault Diagnosis: If the batch leaves the normal region, contribution plots rank the variables driving the deviation so operators can quickly focus their investigation.
How the Batch Classification Workflow Works
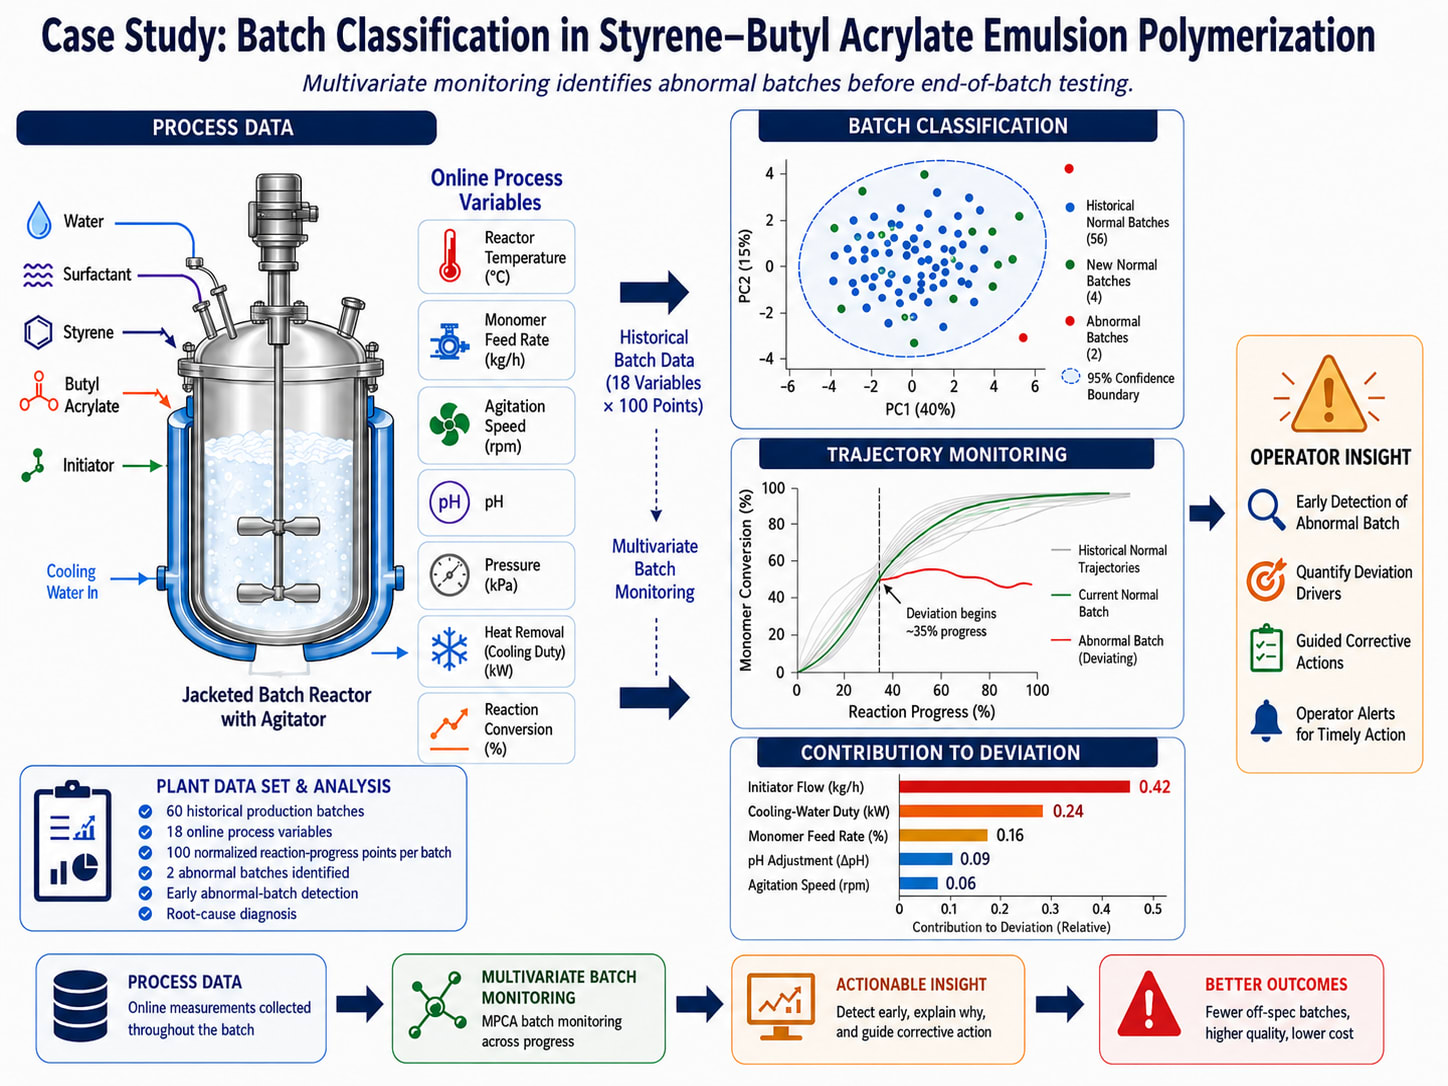
For this study, the model is built from 60 historical production batches, 18 process-variable trajectories, and 100 normalized reaction-progress points per batch. Typical inputs include styrene and butyl acrylate feed rates, initiator flow, reactor temperature, jacket duty, agitation, pressure, pH, and calculated reaction-progress variables. The diagram below shows how these trajectories are converted into an online batch classification and fault-diagnosis workflow.
The Implementation Strategy
A practical deployment can be staged so that the model is validated on historical and live data before operators use its alerts to support batch decisions.
Phase 1: Historical Model Development & Batch Screening
Data Preparation: Collect batch historian data, recipe events, and final quality results. Remove obvious data-quality failures and synchronize each batch to normalized reaction progress.
Reference Set Selection: Screen the 60 historical runs using MPCA score and residual statistics. In this study, 56 consistent batches are retained as the reference population, while 4 normal validation batches and 2 abnormal batches are used to confirm classification performance.
Control Limits & Diagnosis: Establish multivariate confidence limits and test whether known historical deviations generate interpretable contribution patterns.
Phase 2: Online Shadow Monitoring
Live Classification: Run the MPCA model in parallel with normal plant operations and update the batch status as new measurements arrive.
Operator Validation: Compare model alerts with batch records, laboratory results, and operator observations to confirm that the model is detecting meaningful process deviations rather than normal variability.
Study Result: Detecting a Developing Batch Deviation
In this study, a new polymer batch initially tracks inside the normal operating region. At approximately 35% reaction progress, the prediction-error statistic crosses the high-confidence limit and the batch is classified as abnormal. A contribution plot identifies initiator-feed deviation and cooling-duty mismatch as the dominant contributors. The operator can then check feed calibration, cooling performance, and recipe execution while the batch is still in progress. Final quality testing later confirms that the batch was trending toward the high-viscosity side of the product window.
Earlier Detection: The deviation is identified during the batch rather than after final laboratory testing.
Faster Root-Cause Isolation: Engineers can begin with the few variables contributing most strongly to the multivariate deviation instead of reviewing every historian tag.
Explainable Classification: The system provides both a simple normal/abnormal batch status and a quantitative explanation of why the batch was flagged.
The Business Impact
The value of batch classification is the earlier decision window it creates for operations. In this styrene–butyl acrylate unit, the analysis shows how online MPCA can reduce delayed detection, focus troubleshooting, and support more consistent batch execution.
Lower Off-Spec and Rework Risk: Early warning gives operations time to investigate a developing deviation and, where the process allows, make a mid-course correction or prepare an alternate disposition path.
More Consistent Batch Execution: Repeated contribution patterns reveal which feed, temperature, cooling, or mixing trajectories are most associated with abnormal operation and should be targeted for process improvement.
Earlier Quality Visibility: The same synchronized batch structure can be extended with Multiway PLS (MPLS) to estimate final viscosity or other quality attributes before laboratory results are available.
Foundation for Optimization: Once the relationship between process trajectories and product quality is reliable, PLS-based optimization can evaluate feasible operating moves that keep the batch close to the desired quality target while respecting process constraints.